
Read summarized version with:
 ChatGPT
 Gemini
 Perplexity
 Claude
 Grok
Grok
Quick summary
A good ESG score usually falls in the top third of whatever scale is being used. On a common 0 to 100 model, most frameworks treat 70 and above as good performance, 85 and above as excellent, and below 50 as weak. But the number by itself does not tell you much. No two rating providers use the same scale, the same weighting, or the same evidence standard, so a good score from one system can mean something quite different from a good score in another.
The part most guides skip is verification. A company can claim a strong score with nothing but a glossy policy document behind it, or it can earn the same number with audited data behind every material claim. Only one of those is a score you can trust. This guide walks through what counts as good across common scoring systems, why performance and proof need to be judged separately, what a good score looks like in three real business contexts, how 2026 regulatory changes in the EU, Germany, California and India are shifting the bar, and how a company actually builds toward a score that holds up under scrutiny.
What Is a Good ESG Score, Really?
ESG stands for environmental, social and governance, the three broad areas a company’s sustainability performance gets measured against. An ESG score takes all of that activity, climate strategy, worker safety, board oversight, supplier practices and dozens of other topics, and compresses it into a single number or letter grade so that investors, customers, lenders and regulators can compare one company against another without reading through hundreds of pages of disclosure.
Here is the honest answer to what counts as good: there is no single number that applies everywhere. A score is only meaningful relative to the scale it was produced on, the industry the company sits in, and how rigorously the underlying data was checked. That said, a few conventions show up again and again across the market, and they are worth knowing before anyone quotes a number at you.
ESG Score Ranges Explained: Numbers, Letters, and Why They Don’t Line Up
Most ESG scoring systems fall into one of two families. The first uses a 0 to 100 numeric scale, where a higher number means stronger sustainability performance. The second uses letter or tier grades, running from a low grade up through a top grade, similar in spirit to a credit rating. A smaller group of frameworks flips the logic entirely and scores unmanaged risk, so a lower number is actually the good outcome.
Because these scales are not standardised across the industry, the same company can look very different depending on which provider produced the number. A useful rule of thumb across most 0 to 100 systems looks like this:
| Score band | Typical 0–100 range | What it generally signals |
| Weak / poor | Below 40–50 | The company has not put basic environmental, social or governance practices in place, or cannot show that it has. |
| Developing | 40–69 (Bronze to Silver in a badge model) | Some real progress exists, but gaps remain in at least one dimension, or the evidence behind the numbers is thin. |
| Good | 70–84 (Gold in a badge model) | The company is meeting recognised good practice across environmental, social and governance topics, with real outcomes behind the claims. |
| Excellent | 85 and above (Platinum in a badge model) | Leadership-level performance across the board, usually with independent assurance on the numbers that matter most. |
This is the general shape of a good ESG score across the market. ESG Rated uses a similar performance band, with 85 and above earning a Platinum badge, 70 to 84 Gold, 55 to 69 Silver, and 40 to 54 Bronze, but with one important difference covered in the next section: the performance number and the badge are not the same thing.
Why a Good ESG Score Can Still Be a Misleading One
Here is where most explanations of ESG scoring stop short, and where the real risk sits for anyone relying on the number. A performance score answers one question: how well does this company manage environmental, social and governance topics? It does not answer a second, equally important question: how much of that performance can actually be proven?
Two companies can both score 78 out of 100. One backed that score with third-party audited emissions data, line-by-line reviewed policies, and verified supplier records. The other backed it with self-reported answers to a questionnaire that nobody checked. Both numbers say 78. Only one of them is a score worth trusting with an investment decision, a procurement contract, or a public claim.
This is why a rating methodology that separates performance from verification gives a more honest picture than a single blended number. ESG Rated, for example, publishes a Performance score from 0 to 100 alongside an independent Verification level from A, meaning independently audited, down to E, meaning modelled or estimated. The two never contaminate each other: a company cannot buy a higher performance number with strong verification, and its performance is never marked down simply because the proof behind it is still developing. Buyers get to see both sides of the picture, together, every time.
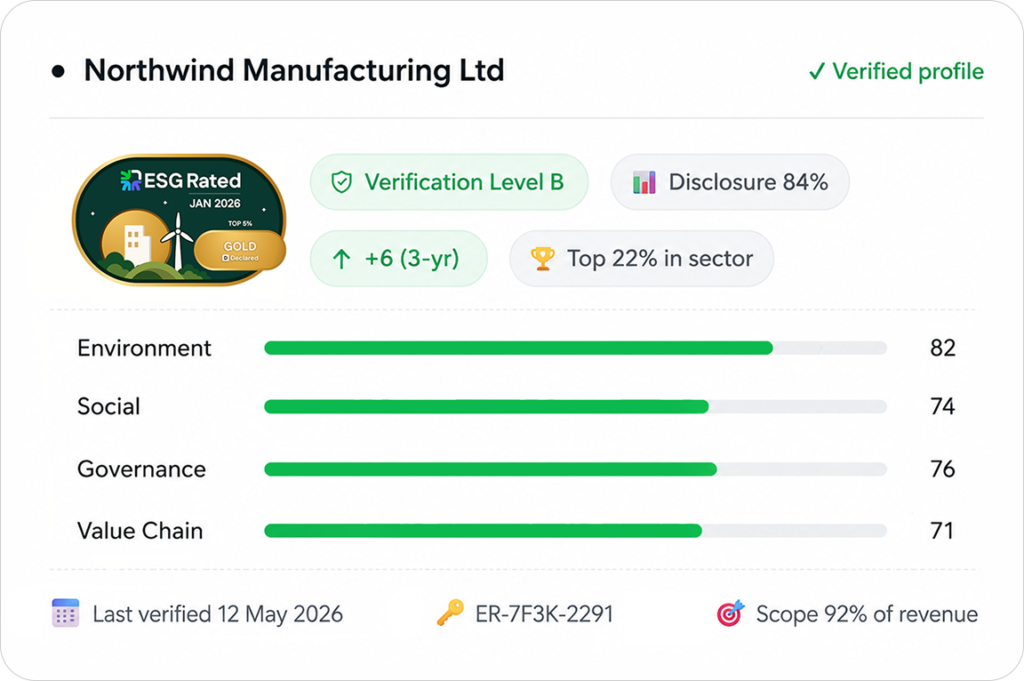
This is also why a genuinely rigorous scoring model builds in gates that a high number alone cannot buy. Under ESG Rated’s methodology, no public medal appears below a C verification level, and reaching Gold or above requires at least a B. A company cannot be Platinum overall while neglecting one dimension entirely, and a rating cannot claim to cover a group unless it actually covers most of that group’s revenue, headcount and sites. A good score, in other words, has to be earned twice: once on performance, and once on proof.
What a Good ESG Score Looks Like in Practice: Three Illustrative Examples
Numbers on a page are easier to understand next to real business situations. The three examples below are illustrative composites built from common patterns seen across different sectors and regions, not disclosures from a specific named company.
A specialty chemicals manufacturer in Germany, roughly 450 employees
This manufacturer had genuinely reduced water use and improved its safety record over several years, supported by solid management systems and training records. Its performance score landed at 79, comfortably in Gold territory. But its assurance on Scope 3 supply chain emissions, greenhouse gases generated indirectly through suppliers and product use, was still self-reported and unaudited. Under a verification-first model, that single gap kept the rating at Gold rather than Platinum, with the scorecard naming the exact reason: strong performance, but assurance still pending on the material environmental metric that mattered most for its sector.
A software-as-a-service company in the United States, around 180 employees
This company had almost no environmental footprint to speak of, and its board oversight, data privacy practices and pay equity metrics were strong and well documented. Its water and waste criteria, which barely applied to its business, were weighted down accordingly by a sector-specific materiality model rather than dragging down a score that measured what actually mattered. Its one weak spot was formal supplier due diligence, an area many smaller technology companies overlook simply because it has never been asked of them. That gap alone kept its overall performance in the Silver range, a reminder that governance strength cannot fully offset a genuine blind spot elsewhere.
An apparel exporter in India supplying a large listed retailer
This exporter was not itself required to report under India’s disclosure rules, since those obligations apply to the large listed retailer buying from it, not to the exporter directly. But because that retailer sits among the top listed companies gradually being asked to disclose value chain data, the exporter found itself needing to supply energy, waste and labour metrics in a format its buyer could use, simply to keep the contract. A good score, in this case, was less about attracting investors and much more about staying inside a shrinking circle of preferred suppliers.
How 2026 Regulations Are Reshaping What Counts as a Good ESG Score
Sustainability regulation has moved fast over the past year, and in several major markets it is moving toward less mandatory paperwork rather than more. That does not lower the bar for what a good score needs to prove. If anything, it raises it, because voluntary and market-driven expectations tend to fill the gap regulation leaves behind.
| Jurisdiction | Where things stand in mid-2026 | What it means for a good ESG score |
| European Union (CSRD / CSDDD) | The Omnibus I directive narrowed CSRD reporting to companies with more than 1,000 employees and over €450 million net turnover, effective for financial years starting on or after 1 January 2027. The CSDDD’s scope was narrowed to companies above 5,000 employees and €1.5 billion turnover, with national transposition due by 26 July 2028 and application from 26 July 2029. | Fewer companies face a legal mandate, but investors, banks and large customers still expect comparable data. A good score built on real evidence travels well regardless of who is legally required to report. |
| Germany (LkSG) | The annual public reporting obligation under the Supply Chain Due Diligence Act is being removed, and enforcement of existing duties is easing until the EU due diligence directive takes its place. The underlying duty to identify and address human rights and environmental risk in the supply chain still stands. | Less paperwork does not mean less scrutiny. Buyers in Germany still expect proof of active risk management, just not in a fixed annual report format. |
| California (SB 253 / SB 261) | SB 253 requires companies with over $1 billion in revenue doing business in California to report Scope 1 and 2 greenhouse gas emissions, with the first deadline pushed to 10 November 2026. SB 261, covering climate-related financial risk for companies over $500 million in revenue, remains paused while a federal appeals court reviews a legal challenge. | US companies operating in California should treat climate data readiness as a near-term requirement, even while one of the two laws sits in litigation. |
| India (SEBI BRSR Core) | Assurance requirements are phasing in from the top 150 listed companies up to the top 1,000 by financial year 2026–27. Reporting on suppliers and customers in the value chain was eased to a voluntary basis in March 2025, though regulators have signalled this will tighten again. | Exporters and suppliers to large Indian listed companies are increasingly asked to supply BRSR-aligned data even without a direct legal mandate of their own. |
Regulatory disclaimer
This overview reflects the publicly reported regulatory status as of July 2026 and is provided for general awareness only. It is not legal advice. Requirements vary by company size, sector, revenue and location, and several of the items above remain subject to ongoing litigation, rulemaking or national transposition. Always confirm current obligations with qualified legal counsel or the relevant regulator directly.
How to Build Toward a Good ESG Score That Holds Up
Companies that chase a number first and evidence second tend to end up with a score that collapses the moment anyone asks a follow-up question. The companies that build a genuinely good score, one that survives due diligence from an investor, a large customer, or a regulator, tend to follow a similar sequence:
- Start from evidence, not from a blank questionnaire. Pull together the sustainability reports, utility bills, certificates, HR records and policies already sitting in a shared drive before answering a single new question. Most of the answers already exist somewhere in the business.
- Fix outcomes, not just paperwork. A recognised methodology weights actual performance, real emissions reductions, safety incident rates, verified pay gaps, far higher than a written policy on its own. A policy earns credit only when it is genuinely adopted: customised, signed, published, and tied to at least one piece of implementation evidence.
- Get independent assurance sooner rather than later. Self-reported data can get a company to an average score. Third-party verified data is what moves a score from good to trusted, and it is increasingly what large buyers and investors are asking for by name.
- Extend the same standard to the supply chain. Whether the pressure comes from a large customer’s procurement team or a listed company managing its own value chain disclosures, suppliers increasingly need to show the same kind of evidence their buyers do.
- Treat the score as a living thing, not a certificate. Evidence ages, circumstances change, and a rating that sat unreviewed for two years tells a buyer very little about the company today.
A Good ESG Score You Can Actually Prove: The ESG Rated Approach
This is the exact gap ESG Rated was built to close. Instead of asking a company to fill out a long questionnaire from scratch, ESG Rated starts with the evidence a company already has, extracts the data points automatically, and has an analyst review every single one before it counts toward the score. What is left is a short set of genuine gaps, not a blank form.
Every rating carries two independent numbers side by side: a Performance score from 0 to 100 covering environmental, social, governance and value chain criteria, and a Verification level from A to E showing exactly how well that performance is backed by evidence. Badges are gated on both, so a strong story can never buy a medal it has not earned on proof, and a company doing genuinely good work is never penalised just because its evidence trail is still catching up.
For a company that wants a score investors, customers and regulators can actually rely on, and a straightforward way to extend that same standard across a supplier network, visit esgrated.com to see how a verification-first ESG rating would apply to your business.
FAQ
On most 0 to 100 scales, a score of 70 or above is generally considered good, and 85 or above is considered excellent. Scores below 50 are usually treated as weak. Always check the specific scale a provider uses before comparing, since not every framework runs from 0 to 100.
A score of 70 sits at or just above the threshold most 0 to 100 frameworks treat as good performance. Whether it is genuinely good depends on how much of that score is backed by independently verified evidence rather than self-reported claims.
Rating providers use different methodologies, different criteria weightings, and different data sources, and none of them are required to follow the same standard. A company can score well with one provider and only moderately with another simply because the two measure different things, or weight the same topics differently.
Not on its own. A high score built on self-reported, unverified claims deserves far less confidence than a lower score backed by audited evidence. Always check the verification level or assurance status behind the number, not just the number itself.
Most credible frameworks call for a full reassessment at least once every twelve months, since evidence ages and circumstances change. Some verification levels are designed to expire automatically after a set period if not refreshed, so the rating cannot coast on outdated proof.
Yes. Well-designed rating models calibrate expectations by company size, so a forty-person firm is not judged against the same governance structure as a multinational. What does not scale down is the evidence standard: a small company still needs to show proof behind its claims, just proportionate to its size.
Last updated: July 2026. Regulations and rating methodologies change regularly. Always verify current requirements with the relevant regulatory authority or rating agency.